Feeds:
Posts
Comments

Dynamic Calibration

A wand of fixed length is waved throughout the whole volume of motion capture. Our goal is to calculate the relative position of the wand and thereby its length that is captured by the video cameras. By this process we can come to know that if the cameras have captured correctly the location and orientation of the wand or not.

For example, if 2 cameras  capture 2 markers that are fixed at the end of a moving wand of length 75cm (750 mm), the length of the wand could be found out if we know the x,y and z coordinates of those 2 markers at any particular time.

We can use the following formula to calculate the distance between the two markers of the wand: = SQRT((X2-X1)^2+(Y2-Y1)^2+(Z2-Z1)^2).

1) What if the cameras are kept side by side to the movement of the wand?

We might have lots of possibilities to miss out seeing both the markers at certain orientation. This might result in wrong calculation of the distance of the wand in certain orientation/coordinates.

Fig. 1. If you look at Fig. 1. the distance of wand ranges between 745 mm to 775 mm across the time. But we know the wand has a fixed length,  and therefore there is an error while capturing the markers in the wand. The error is at the z coordinate where both markers appear to be at a single position, which means only one marker was visible at that particular orientation!

2) What if the cameras are kept right angle to each other when they capture the movement of the wand?

The cameras will capture the markers in the wand in all possible orientation. We will have accurate length of the wand in any direction of the movement.
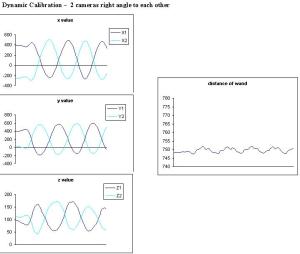
Fig. 2. The markers of the wand were captured in all directions with a near perfection and therefore, the distance/length of the wand remains relatively stable at 750 mm.

Static Calibration

One-dimension:

A retro-reflective marker is placed at the center of room (presumably starting point of x,y coordinates), within all camera’s field of view. The cameras set the distance from that point to calibrate statically their positions with respect to the x,y starting point (presumed).

3-Dimension:

A L-frame is used for the reference object with known distance for the capture volume.

Introduction and basics:

Motor Unit:

Motor unit is an alpha motor neuron and the muscle fibers it supplies. Motor units vary in size, smaller motor units supply few muscle fibers and larger motor units supply many muscle fibers. The motor units follow ‘All-or-None’ law. When a motor unit fires, it stimulates all the muscle fibers simultaneously.

For object manipulations we apply forces according to the object’s size. For example, picking up a coin and a heavy book involve different force levels. How do we grade this force level?

Supposing if we flex our elbow to pick a heavy book, are we applying the maximal force at once? Does the force level peak as we start picking the book?

Recruitment:

Here is where Henneman’s size principle come into play. The motor units are recruited in a graded manner – from small to large. Recruitment occurs across the motor units.

Rate coding:

Within each motor unit, initial force production is lower when compared to the later force production. As the rate of firing increases, ‘summation’ effect takes over and builds over the initial force. i.,e initial small twitch like contraction will build over to produce a constant higher force contraction.

Ref: Henneman, E (1957) Science 126, 1345-1346.

When we use a measuring device in the lab to measure something, we need to make sure that our test is valid and reliable.

So what do they mean?

Validity:

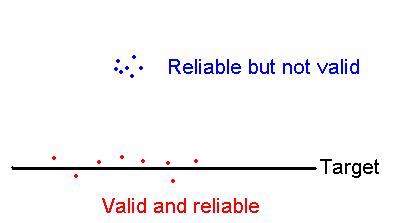
Validity means our device measures what we want to measure in a fairly accurate way. How do we know that our device measures precisely? We might have some universal measurement and if our device shows a good correlation with that universal measurement, then we could say proudly that our measuring device is valid 🙂 So, what you do is basically compare your measurement/test with another valid test.

Reliability:

Reliability is the repeatability of our test. That is, how consistent is our measurement every time.

Example 1: Supposing our device is a weight measurement device and each time it shows a different weight, say 100 lbs one time and after 10 minutes 150 lbs, can we rely on that measurement? The test-retest is not reliable.

Example 2: Supposing we are using a new-goniometer-kind of device to measure the joint angle for an individual. Person A is recording 50 deg, while person B is recording 70 degrees for the elbow flexion of the same individual. Can we rely on this device? Each person is getting a different output.  The inter-rater reliability is bad.

reliableThe picture depicts the targets of an archer. The blue clustered targets show that the archer is way-off from the actual target (in our case, measurement) but is consistent. However, our measurements need to be close to the target in order to be valid. Therefore, reliability does not guarantee that our device measures fine. We need validity so that we can say that our device measures what we actually want to measure.
Sampling Frequency

What is sampling frequency?

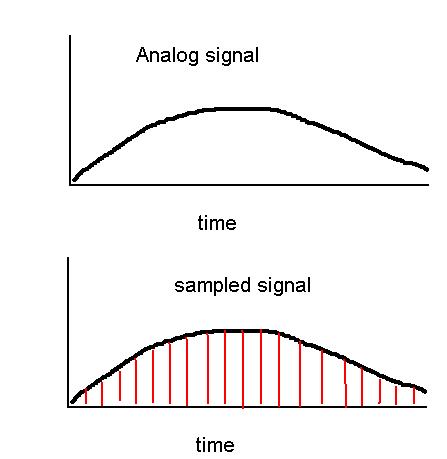
When we convert an analog (continuous) signal to a digital (discrete) one, the frequency at which we sample the signal is termed as sampling frequency or sampling rate. How frequent are we sampling is the sampling frequency. Supposing we sample at 1000 cycles  or units per second, then the sampling frequency is 1000 Hz.signalEither we can mention the digital signal by its sampling frequency or by the sampling interval. Sampling interval is the interval between any two samples. Here in our case (1000 Hz-sampling frequency), the sampling interval will be 1/1000 = .001 (1 millisec).
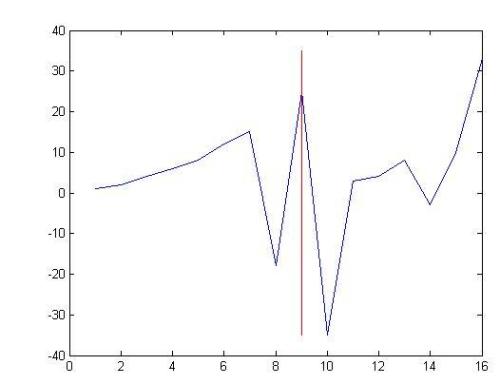
To find  a threshold in a one-dimensional array and plot the same in Matlab: Here is the plot you will get after running the program.

threshold

a=[1 2 4 6 8 12 15 -18 25 -35 3 4 8 -3 10 33];
b=abs(a);
c=max(b);
m=min(a);
d=.7*c; k=1;
for i=1:size(a,2)
if b(i)>=d
k=i;
break
end
end
plot(a);
line([k,k],[c,m],’Color’,’r’,’LineStyle’,’-‘,’LineWidth’,1);

a=[1 2 4 6 8 12 15 -18 25 -35 3 4 8 -3 10 33];    % one-dimensional array

b=abs(a);  % rectifying the data

c=max(b);  % finding out the maximum value

m=min(a);

d=.7*c;    % finding the threshold value, say 70 percent of the maximum value

k=1;

for i=1:size(a,2) % size of the array

if b(i)>=d

k=i;

break

end

end

plot(a);

line([k,k],[c,m],’Color’,’r’,’LineStyle’,’-‘,’LineWidth’,1);

Osmosis

Diffusion?

Whenever there is a concentration gradient difference of molecules exists, diffusion occurs. Molecules typically move from an area of higher concentration to lower concentration. For example, when you add a spoonful of salt in a test tube, which is separated by a permeable membrane, the salt diffuses across the water.

Solvent – water

Solute – salt

Net result – diffusion

Example in human body: Oxygen diffuses from an area of high concentration (artery) to an area of low concentration (cell).

Osmosis?

Now, in the above example, supposing if the membrane is selectively permeable , i.e., if the membrane allows only the movement of the solvent (water) and not the solute (salt), then osmosis results. Water will diffuse across the semi-permeable membrane from the low-solute concentration (no-salt) to the high solute concentration (salt), until solvent-equilibrium results. This net diffusion of water occurs passively, i.e., they do not require any energy.


For example, if you sauté any vegetables with salt, the water oozes out because of osmosis!

Example in plant kingdom: roots from trees suck up the water from soil using osmosis.

So, what happen if you place  cell that is covered by a plasma membrane (which is selectively permeable) in hypo or hyper tonic solutions?

1. If you place a cell in a hypertonic solution (less water & more solutes), the cell will shrink in size.

2. If you place a cell in a hypotonic solution (more water & less solutes – example tap water), the cell will drink up the water & swell!

Check these videos to understand the concept better!


Arithmetic sequence:

If you take a sequence of numbers, the difference between any two numbers will be constant.

Eg: 2, 4, 6, 8, 10, 12, 14…..

Arithmetic series:

Sum of the above mentioned arithmetic sequence of numbers.

Eg: 2+4+6+8+10

Here is a question for u. How will you calculate the sum of the arithmetic series 2+4+6+8+10?

The formula is s = ((a1+an)/2)*n, where a1 is the first number, an is the last number and n is the number of sequence.

S = ((2+10)/2)*5 = 30

What if you want to read the second column from the two dimensional array given below. Two for loops – one nested inside will read it. 

What about writing it in c??
 Here is the program.
#include <stdio.h>
int main()
{
int a[3][4];  //allocate space for 2-dimensional array
int i, j, p;
for(j=0;j<3;j++)  // to generate the 2-dimensional table – nested loops
{
for(i=1;i<5;i++)
{
a[j][i]=i;
printf(“%d “, a[j][i]);
}
printf(“\n”);
}
printf(“enter column number: “);  
scanf(“%d”,&p);
for(j=0;j<3;j++)
{
for(i=1;i<5;i++)
{
if (i==p)   // to print the rows in that particular column
{a[j][i]=i;
printf(“%d”, a[j][i]);
}
}
printf(“\n”);
}
}

Doubling Time

The quickest way to remember the doubling time if you know the rate of growth (provided it is constant) is to remember this formula:

T2 = 70/rate

You can ask me how did I get this. Its simple, just take the use of exponential function.  .7 is nothing but the natural log of 2 to base e.

Example: if you have $10,000 in the bank with a constant rate of growth, say 3%. So, when do you think you could get the double amount?

70/3 = 23.3 years. So, in 23 years whatever you’ve invested will double.